This is where my data work lives. I'm drawn to the messy problems — the ones where the answer exists but it's buried across a dozen sources, in inconsistent formats, going stale by the day. I pull that data together, make it trustworthy, and turn it into something a business can act on.
Data analysis · Web scraping & data pipelines · Data cleaning & normalization · Change tracking over time · Dashboards & visualization · Turning findings into recommendations
I built a Python platform that tracks 5,300+ collision-repair shops across 17 national operators and cross-references which insurance Direct Repair Programs (DRPs) accept each location — turning a fast-moving market that analysts used to map by hand into a live, queryable dataset that flags acquisitions, rebrands, and closures as they happen.
The U.S. collision-repair industry is consolidating quickly. Private-equity-backed operators are rolling up independent shops, large networks acquire and rebrand each other, underperforming locations quietly close, and insurers increasingly steer work toward shops inside their Direct Repair Programs. For anyone trying to understand this market — an investor weighing an acquisition, a supplier deciding where to expand, an analyst tracking market share — the core questions are simple: who owns what, where, and which insurer networks accept it?
The answers are scattered across 17+ corporate store-locators that each update on their own schedule and in their own format, and they go stale the moment a shop changes hands. There was no single, current source of truth — just a pile of websites and a lot of manual copying.
The decision-makers who live or die by this picture: corporate-development and M&A teams at operators and PE firms choosing where to acquire next, insurance network managers hunting for DRP coverage gaps, and suppliers and analysts sizing up competitors. The decisions riding on it — where to buy, build, or compete — are worth millions, and they were being made on lists that were out of date before the spreadsheet was even finished.
I reverse-engineered each operator's authoritative data source — XML sitemaps, embedded page JSON, AJAX endpoints, and per-state listings — and built 17 scrapers that run in parallel and write to a single historical database. Because every site is structured differently and several deploy anti-bot defenses, the platform does three things most one-off scrapers don't:
Where a site reliably blocks automation, I built a clean manual-refresh fallback instead of fighting it — a deliberate choice to keep the data honest rather than brittle.
Tools: Python, Playwright, requests / curl_cffi, rapidfuzz, SQLite, openpyxl.
Operational figures come from the platform's own run data; the business-impact framing is illustrative.
Counts reflect public store-locators, which can lag real-world openings and closings by a refresh cycle; one operator's anti-bot protection blocks automation reliably, so its data refreshes on a weekly manual cadence.
The next layer I'm adding is certification data. The platform already maps who owns each shop and which insurer repair networks steer claims its way; next, I'm building in which shops are certified by the automakers themselves to repair their vehicles. That distinction is becoming a real competitive moat — as cars grow more complex, with aluminum bodies, driver-assist sensors, and electric drivetrains, manufacturers certify only a limited set of shops to work on their newer models, so a certification signals which operators can win the most complex, highest-value repairs. I'm also widening insurer coverage so the view of who gets steered claims work is complete across every major carrier rather than just a subset.
"My whole life I have been a book worm. My childhood was filled with flashlights under the covers, desperate for one last chapter. As I aged I realized that love would never fade, just evolve. So I began keeping track of each book I read on assorted apps. One day I discovered Google Sheets and my obsession grew from there. Every book I've read since 2017 has been meticulously logged and tracked.
I learned how to code and scrape websites so that my list could automatically update. For years I would sit down for hours a week to update my to read list and assorted important data, such as amazon rating, price, amount of reviews, etc. That monotonous task drove me to innovate and change. I learned how to use Tableau (a data visualization tool) to track the patterns in my reading habits. Many things can foster my passion but no matter how many times the seasons change, I will always return to my love of reading."

Ziva's investor presentation buried a strong pitch under cluttered, text-heavy slides that were hard to follow — the kind of deck that loses a room before the idea lands.
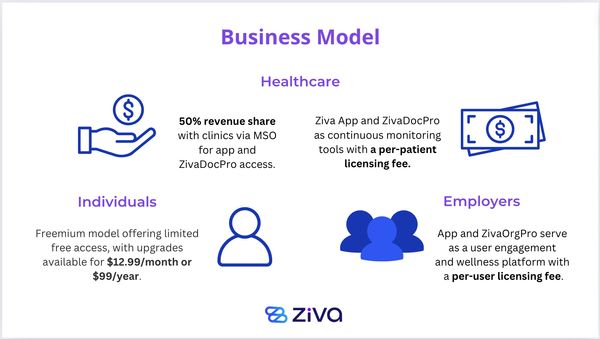
Drawing on formal training in presentation design, I rebuilt the deck around a clear narrative — cutting clutter, tightening the messaging, and giving each slide one job. The reworked version holds attention long enough for the strength of the pitch to come through.
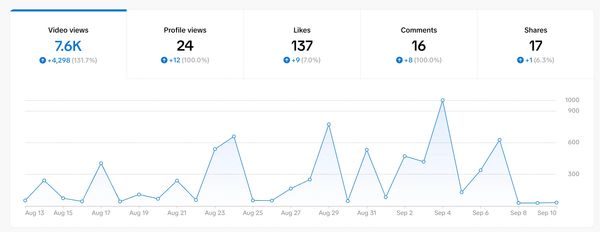
Beyond the deck, I designed and ran a test-and-learn social strategy to see what resonated with Ziva's audience. Engagement-focused campaigns drove a 131% increase in TikTok views and a 100% jump in profile visits — turning a quiet presence into measurable reach ahead of launch.